
What Is Dynamic Light Scattering (DLS)?
Dynamic Light Scattering is a fast, non-destructive technique for measuring the size and uniformity of particles in suspension, from the nanoscale up to a few micrometers.
Also known as Photon Correlation Spectroscopy (PCS) or Quasi-Elastic Light Scattering (QELS), DLS calculates the particles’ hydrodynamic diameter and size distribution to assess particle aggregation, uniformity, and stability.
At Covalent, DLS is one of our core tools for quality control and material characterization. From monitoring nanoparticle dispersions to assessing protein or polymer formulations, we provide data that helps guide formulation choices and assess long-term stability.
Analytical Outputs
Resolution & Sensitivity
Measurement Principle
Why Use DLS?
When particle behavior at the nanoscale dictates real-world performance, DLS delivers:
- Nanometer sensitivity: Detects subtle changes in particle behavior.
- Rapid measurement: Minutes per sample, with real-time feedback.
- Non-destructive: Sample integrity is preserved.
- Low-volume compatible: Works with as little as 12 µL.
- Comprehensive output: Particle size distribution, Z-average, PDI, size percentiles, correlation function.
Stability Monitoring
Correlative Insights
Sample-Friendly Throughput
How Dynamic Light Scattering Works
Every particle in suspension moves randomly due to collisions with the surrounding solvent molecules and other particles. This motion, known as Brownian motion, causes laser light scattered off these particles to fluctuate in intensity.

In DLS, these fluctuations are detected and represented as an autocorrelation function, which tracks how the signal loses coherence over time. The rate of decay of the signal coherence reflects particle size: faster decay indicates smaller particles, which diffuse more rapidly. This data is directly related to the translational diffusion coefficient (D, the ‘speed of the particles’), which is then applied in the Stokes-Einstein equation to determine the hydrodynamic diameter of the particles:

The hydrodynamic size includes both the particle and its surrounding solvation layer. We compute:
- Z-average diameter: Intensity-weighted cumulant mean.
- Polydispersity Index (PDI): Size uniformity metric.
- D10 / D50 / D90 percentiles: Key size thresholds for particle populations.
We review the data closely to identify anomalies, subtle shifts, or trends that may affect formulation performance.
Equipment Used for DLS

Anton Paar Litesizer 500
- Dynamic light scattering particle size and zeta potential measurements.
- Zeta potential and molecular mass measurements via ELS and Static Light Scattering (SLS).
- Refractive index measurements.
- Measurement angles: 15° (forward scatter), 90° (side scatter), 175° (backscatter).
- Particle size range: ~0.3 nm – 10.0 μm.
- Zeta potential measuring range: ≥ ±1000 mV.
- Maximum sample conductivity: 200 mS/cm.
- Accuracy and repeatability: better than ±10% and ±3%, respectively.
- Laser light source: 658 ± 3 nm, 40 mW.
- Temperature control range: 0–90°C (±0.3°C accuracy).
Key Differentiators
All DLS measurements are performed on the Anton Paar Litesizer 500, an integrated system for Dynamic Light Scattering (DLS), Electrophoretic Light Scattering (ELS), and Statis Light Scattering (SLS).
| Parameter | Specification |
|---|---|
| Size Range | 0.3 nm to ~10 µm (hydrodynamic diameter) |
| Sample Volume | 12 µL to 2 mL (based on cuvette type) |
| Temperature Control | 0°C to 90°C ± 0.3°C |
| Detection Angles | 15° (forward), 90° (side), 175° (backscatter) |
| Laser Source | 658 nm ± 3 nm, 40 mW |
| Compatible Media | Aqueous and selected organic solvents |
| Accuracy / Repeatability | ±10% accuracy, ±3% repeatability |
| Analysis Outputs | Z-average, PDI, D10/D50/D90, Particle Size Distribution, Autocorrelation function |
| Zeta Potential Range | ±1000 mV (via ELS module) |
| Molecular Mass Range | 300 Da to 20 MDa |
We use our in-lab solvent property library and literature references to ensure accurate results across different chemistries and media.
Strengths
In solution-phase analysis, DLS stands out for its speed and sensitivity, all while using minimal material.
Key advantages:
- High sensitivity to low-level aggregation and size drift.
- Provides insight into sample uniformity and agglomeration behavior.
- Compatible with a wide range of materials and particle sizes.
- Suited for high-throughput screening.
- Enables time-course tracking and trend analysis.
Limitations
Like any analytical technique, DLS, while highly capable, has limitations that must be considered for reliable interpretation:
- Sensitive to contaminants such as dust, air bubbles, and fibres.
- Intensity-weighted outputs are based towards larger particles.
- Limited resolution for distinguishing minor subpopulations.
- Assumes spherical, non-interacting particles in calculations.
- Cannot measure particle concentration or internal structure.
- May produce inaccurate results in highly concentrated or turbid samples.
- Requires precisely known solvent properties for valid hydrodynamic sizing.
At Covalent, we address these limitations through controlled sample-prep, method prep, and cross-validation.
Example Outputs
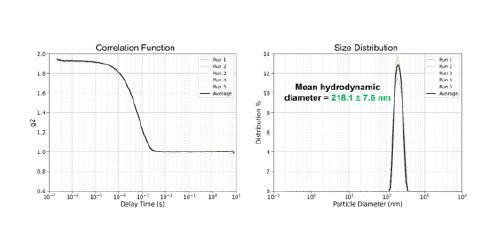
A standard DLS output includes two key plots: the correlation function and the size distribution curve.
The correlation function reflects how fast particles diffuse based on how quickly the scattered light signal decays. A clean, exponential decay suggests stable, monodisperse samples. The size distribution shows particle sizes weighted by scattering intensity, typically on a log scale.
Sample Requirements
- Sample State and Volume:
- Must be a stable liquid dispersion.
- Powders may be dispersed in non-dissolving solvents.
- Minimum volume: 12 μL, although 1.5 mL or more is strongly preferred.
- Particle Size Range:
- 0.3 nm to ~10 µm (ideal sample limitations).
- Suspensions must remain stable during measurement (stability can be assessed).
- Concentration:
- Minimum of ~0.1 mg/mL for protein systems.
- Optimal transparency: 60–80%.
- Highly turbid samples may require dilution.
- Solvent Properties:
- The refractive index (n) and viscosity (η) of the solvent must be known; particle refractive index can also help, but is not required.
- Covalent maintains an extensive solvent property library; relevant literature may also be referenced.
DLS Applications by Industry
Biomedical & Biotherapeutics
- Protein aggregation monitoring.
- Sizing of micelles, liposomes, exosomes, etc.
- Drug‑loaded or surface‑modified carriers.
- Virus‑like particles (VLPs) or lipid nanoparticles (LNPs).
- Scaffold particle sizing and uniformity.
Battery Materials
- Sizing of nanoparticle or fine‑fraction active materials.
- Electrode coating stability.
Food & Beverage
- Flavorings and flavorants emulsion droplet sizing.
- Colloidal stability.
Environmental & Agricultural
- Nanoparticle or colloidal pollutant monitoring.
- Size control and monitoring of agricultural chemicals.
Techniques That Complement Dynamic Light Scattering
DLS is a powerful tool for nanoparticle sizing, but complementary techniques can provide deeper insights. Depending on your project goals, additional analyses such as chemical, surface, or porosity characterization may become necessary. At Covalent, we offer many of these techniques in-house or through our extensive network of vetted partner laboratories. Consult with us to identify the right mix of methods for your specific challenges, including:
Why Choose Covalent for DLS Needs?
Covalent delivers accurate, high-quality DLS results with fast turnaround times and competitive pricing. We achieve this through continued investment in advanced instrumentation and deep technical expertise, enabling us to handle a wide range of samples, projects, and complex challenges.
Our team takes a rigorous, solutions-driven approach, whether through precise and careful sample preparation, working with exotic solvents, iterative method development, or customized reporting. We focus on finding the most effective path to generate reliable, actionable data.
For routine quality control and process development, we offer scalable services with flexible pricing, including volume discounts. For more complex particle analysis challenges, our broader network of capabilities positions us as a comprehensive partner, ready to solve multi-faceted problems and deliver decision-ready insights.