
What is Ellipsometric Porosimetry?
Ellipsometric porosimetry, sometimes referred to as thin film porosimetry, is an optical characterization technique used to quantitatively measure porosity and pore size distribution in nanoscale thin films. The method combines spectroscopic ellipsometry with controlled vapor adsorption to monitor changes in the effective optical constants and thickness of a porous film. By analyzing adsorption–desorption behavior as a function of vapor partial pressure, Ellipsometric porosimetry enables determination of total porosity, pore volume fraction, and mesopore size distribution in substrate-supported films. The technique is particularly suited for low-k dielectrics, porous oxides, hybrid organic–inorganic films, and other nanostructured materials where bulk porosimetry methods are not applicable.
Why Use Ellipsometric Porosimetry?
- Enables quantitative porosity and pore size analysis in thin films typically ranging from a few nanometers to several micrometers in thickness.
- Non-destructive and compatible with wafer-level and device-relevant samples.
- High sensitivity to subtle changes in refractive index and film density.
- Provides in situ adsorption–desorption isotherms under controlled environmental conditions.
Quantitative Thin-Film Porosity
Non-Destructive Testing
Characterize porous coatings directly on wafers and device structures without altering the sample.
In Situ Environmental Measurements
How Ellipsometric Porosimetry Works
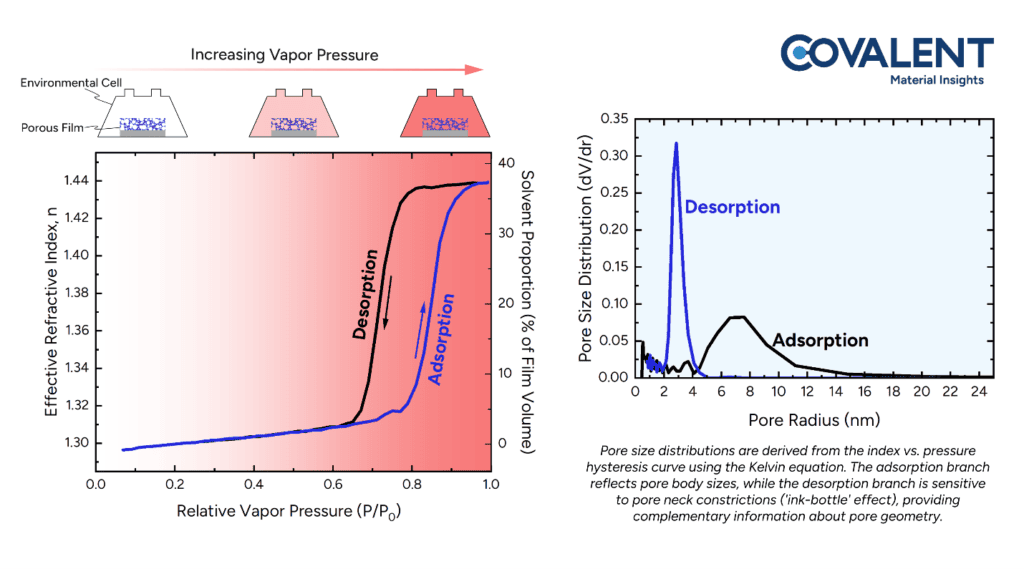
Ellipsometric porosimetry measures the change in optical response of a porous thin film during controlled exposure to a condensable vapor. As vapor pressure increases, adsorbate molecules initially form surface layers and subsequently undergo capillary condensation within mesopores, leading to a measurable increase in the film’s effective refractive index. Spectroscopic ellipsometry continuously monitors changes in Ψ and Δ, which are modeled to extract film thickness and optical constants as a function of vapor pressure. Adsorption and desorption isotherms are interpreted using effective medium approximations and capillary condensation models such as Kelvin equation-based analysis to determine porosity and pore size distribution.

Equipment Used for Ellipsometric Porosimetry
Covalent performs ellipsometric porosimetry using J.A. Woollam RC2 spectroscopic ellipsometer integrated with dedicated environmental control hardware. Typical measurement configurations include:

J.A. Woollam RC2
- Single angle (70⁰) spectroscopic ellipsometerY covering UV–VIS–NIR spectral range.
- Sealed Environmental Chamber: To contain the sample, temperature stabilization to ensure adsorption equilibrium and measurement repeatability
- Bronkhorst Flow Controller: Enables controlled relative pressure or humidity steps
- Vapor Generator: Houses high precision flow controllers, atomizing nozzle and solvent storage tank.
- Advanced optical modeling and data analysis software for porosity extraction (JA Woollam CompleteEASE software).
- Measurement configurations are customized based on film thickness, optical contrast, substrate type, and expected pore size regime.
Key Differentiators
Strengths
- Direct, non-destructive measurement of porosity in substrate-supported thin films
- High sensitivity for mesoporous structures and low porosity materials
- Capable of distinguishing adsorption and desorption behavior, providing insight into pore connectivity and hysteresis
- Compatible with in-situ studies of process-induced or environmental changes.
Limitations
Requires optically smooth, laterally uniform films for reliable modeling
Accuracy depends on appropriate selection of optical models and effective medium approximations
Limited sensitivity to macropores and closed porosity. This technique is sensitive to samples whose surface have the open pores. Closed pores in the surface cannot absorb the evaporated solvent.
Strongly absorbing or highly rough films may reduce measurement reliability
For our environmental chamber can accommodate samples up to 10 x 3 cm.
Example Output
Sample Requirements
- Currently, our environmental chamber (shown above) can fit up
to a 10 x 3 cm sample, a sample size more than this need to be cut or broken. - The samples should have smooth surface finish to able to reflect the source beam rather than a matte finish.
- Thin films samples deposited on well-characterized and optically smooth surfaces such as Si, glass, or another known material. If the substrate optical properties are not already known, a separate blank substrate or reference sample should be provided for baseline optical modeling.
- The porous film surface must be open and accessible from the top so that the probe vapor can adsorb into and desorb from the pore network during the measurement.
- Films should be clean, dry, and mechanically stable under the selected vapor exposure conditions, with no capping layer or surface contamination that would block pore access.
Ellipsometric Porosimetry Industry Applications
Semiconductor and Microelectronics
Ellipsometric porosimetry is used to quantify porosity and mesopore size distribution in substrate-supported low-k and ultra-low-k dielectric thin films where bulk gas adsorption techniques are not applicable. The method enables analysis of adsorption–desorption behavior, moisture uptake, and porosity changes induced by plasma processing, thermal annealing, or chemical treatments without removing the film from its substrate.
Photonics and Display Manufacturing
Ellipsometric porosimetry is used to characterize porous optical coatings, antireflective coatings, photonic films, and refractive-index-engineered layers where porosity directly controls optical performance. The technique tracks adsorption-induced changes in refractive index and film thickness, enabling manufacturers to optimize deposition, curing, and post-treatment conditions for optical uniformity and device reliability.
Research and Advanced Materials Development
Ellipsometric porosimetry supports universities, national laboratories, and industrial R&D groups developing novel porous-thin films where bulk porosimetry is impractical. It enables comparison of synthesis routes, surface functionalization, densification, and post-deposition treatments while preserving the as-deposited thin-film state.
Techniques That Complement Ellipsometric Porosimetry
It provides bulk surface area, pore volume, and pore size distribution for powders, pellets, or high-surface-area materials where sufficient sample mass is available, while ellipsometric porosimetry is better suited for substrate-supported thin films.
Why Choose Covalent for Ellipsometric Porosimetry?
Covalent offers deep expertise in optical metrology, thin film modeling, and nanoscale materials characterization. Our Ellipsometric Porosimetry measurements are performed by experienced scientists who understand both the strengths and limitations of the technique and the underlying physical assumptions. We emphasize rigorous optical modeling, cross-validation with complementary methods, and transparent reporting of uncertainties.